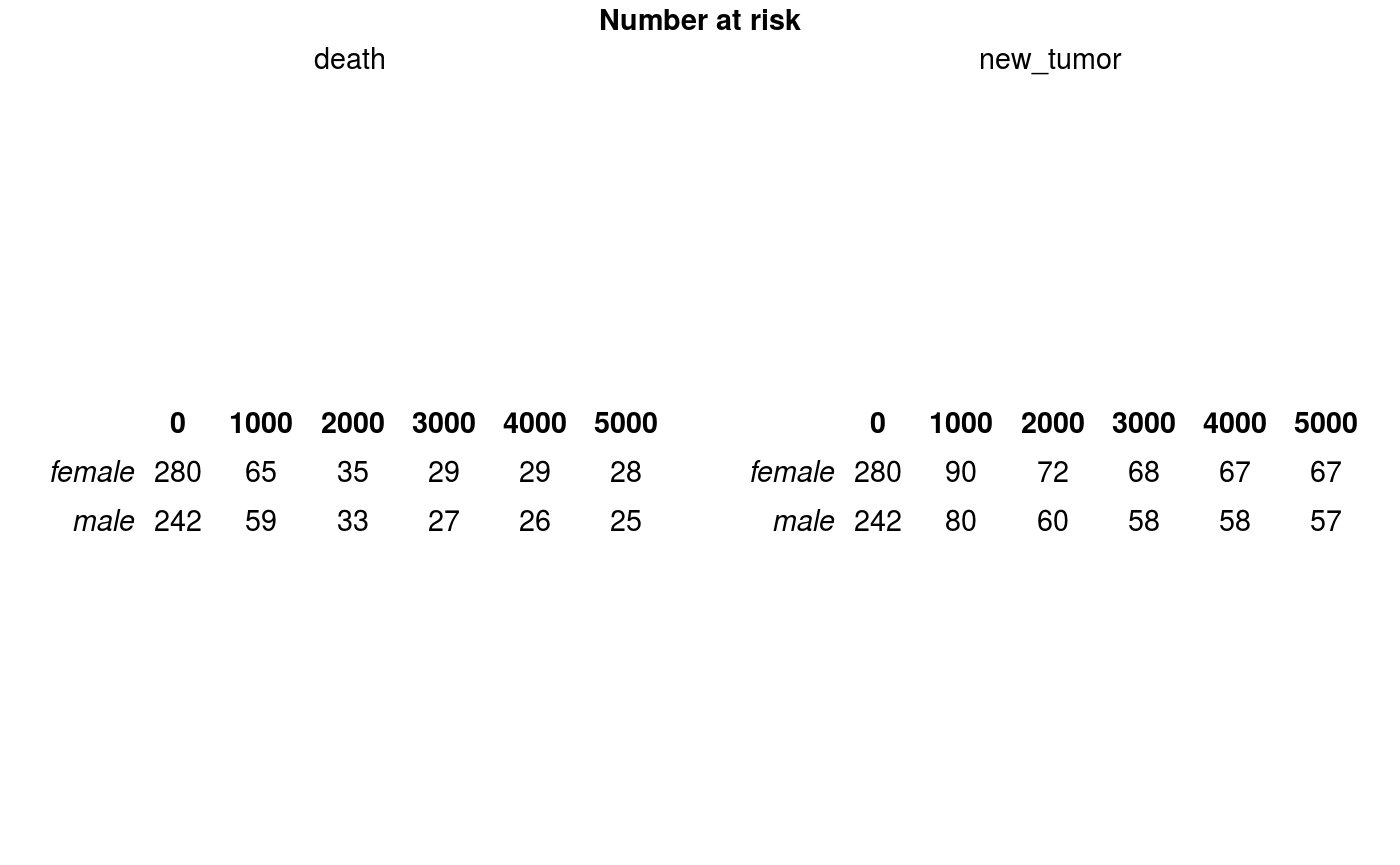
Number at risk table
Creates a table for each risk, containing number of observation at risk in given time points in groups.
riskTab(time, risk, group, cens = NULL, title = "Number at risk")
Arguments
| time | vector with times of the first event or follow-up, must be numeric. |
|---|---|
| risk | vector with type of event, can be numeric or factor/character. |
| group | vector with group variable, can be numeric or factor/character. |
| cens | value of 'risk' indicating censored observation (if NULL, the first value of 'risk' vector will be taken). |
| title | title of a table |
Value
A grob with n tables, where n is number of risks. Each table contains number of observations at risk in each group in given time points (the time points correspond to breaks at x-axis of plots with survival curves).
See also
Examples
riskTab(time = LUAD$time, risk = LUAD$event, group = LUAD$gender, cens = "alive",
title = "Number at risk")