Competing Risks Models Summary
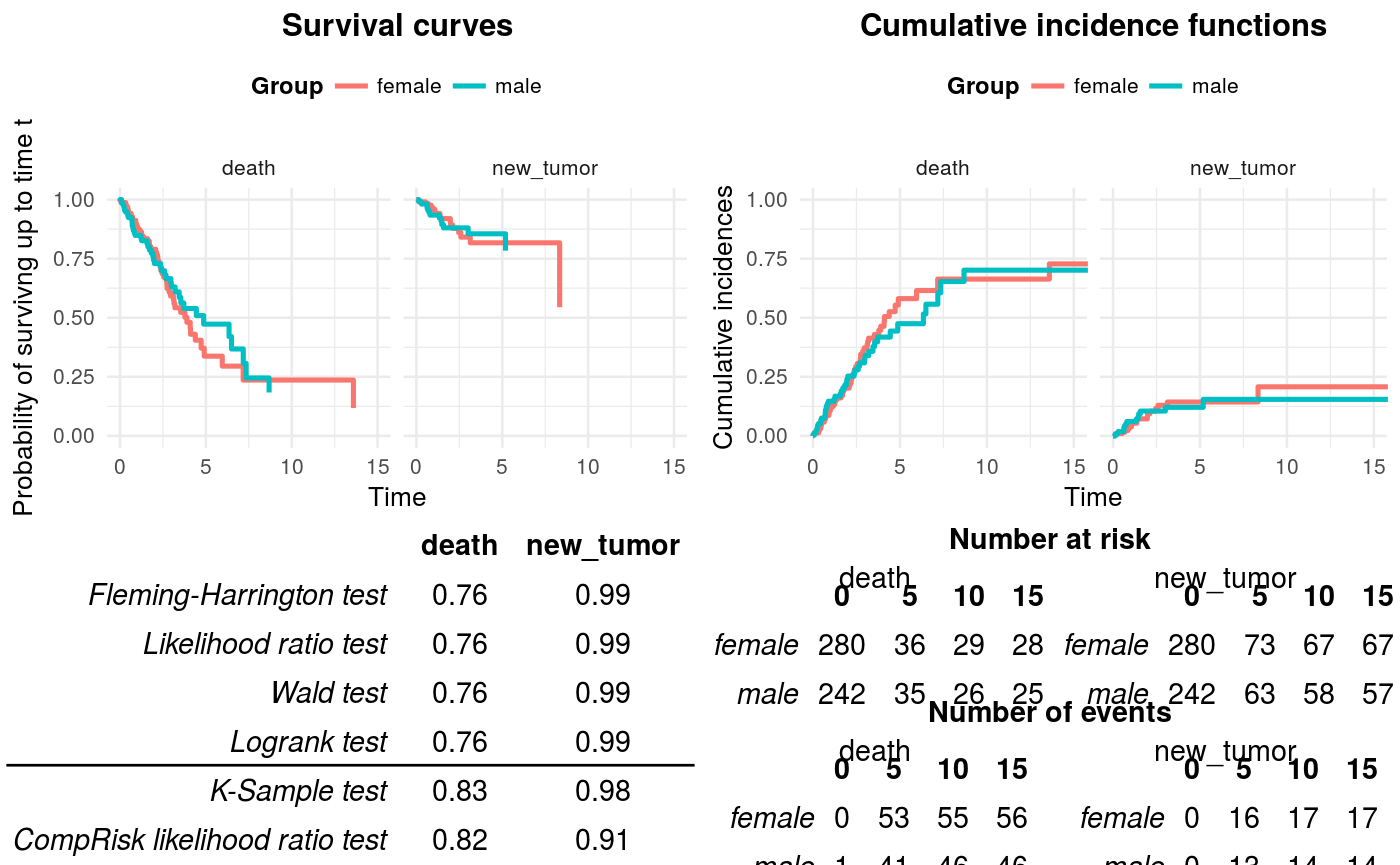
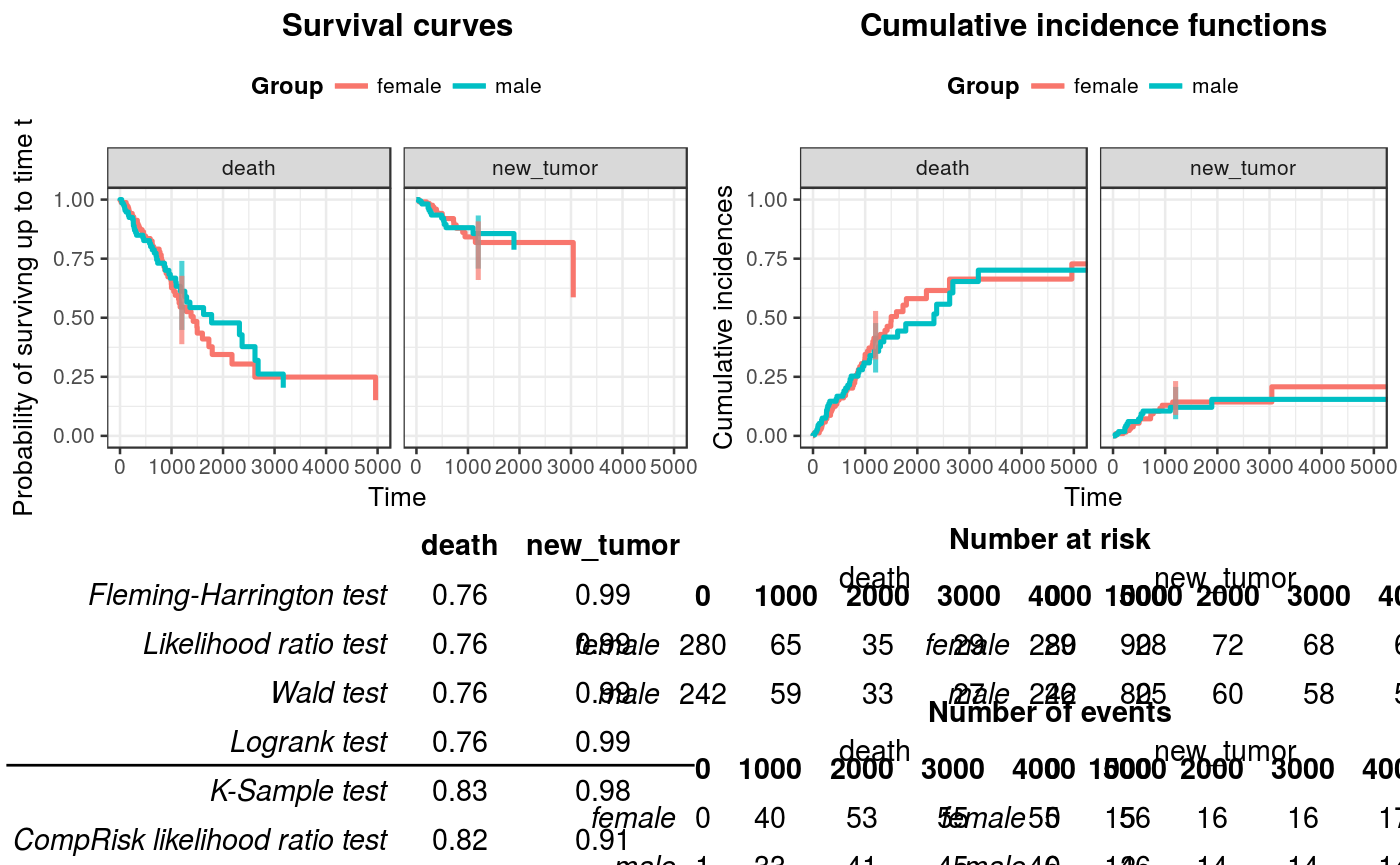
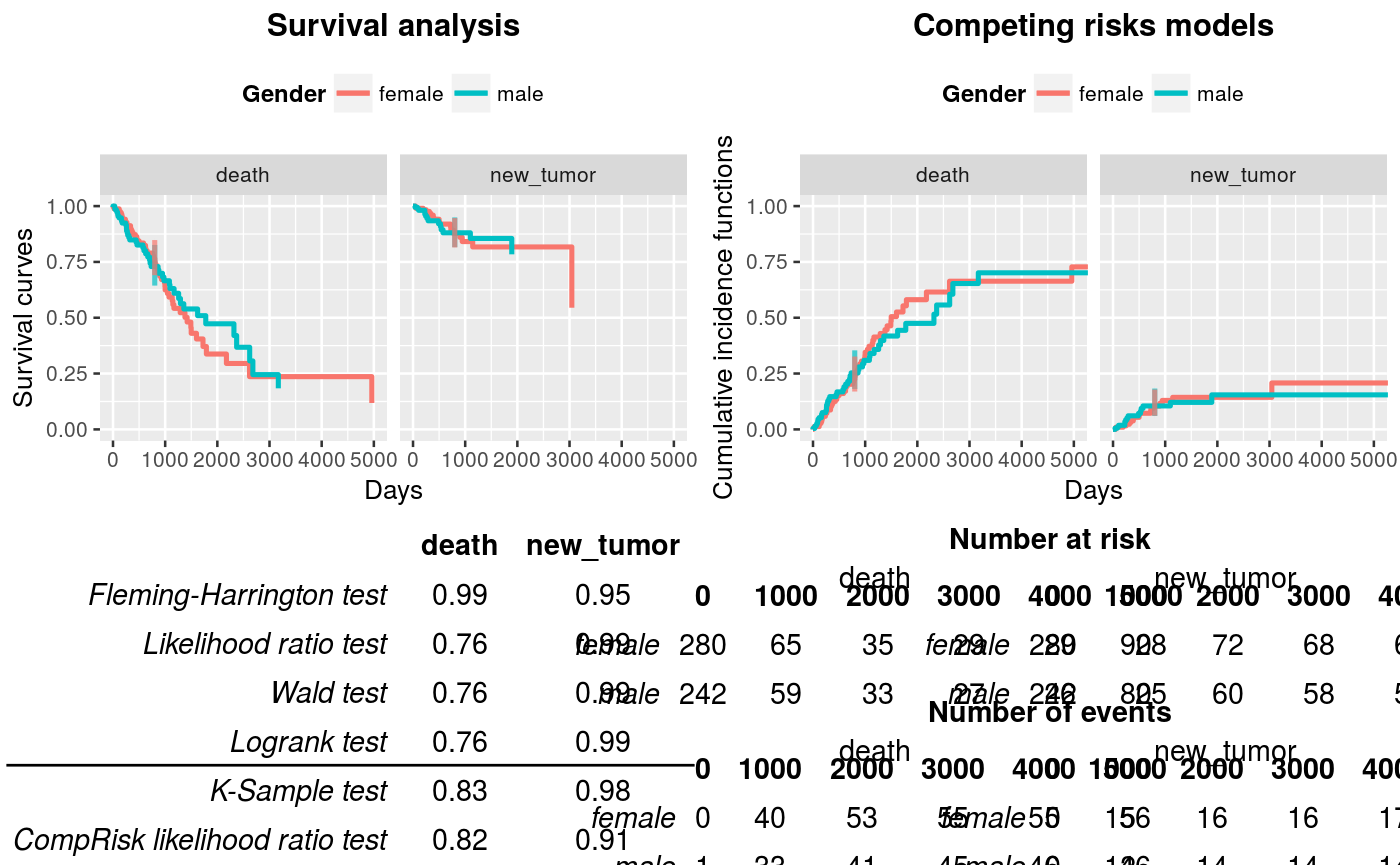
Generates summarized report, including visualisation of survival and cumulative incidences curves, diagnostic tables and p-values of tests comparing models between groups.
summarizeCR(time, risk, group, cens = NULL, rho = 0, target = NULL,
  type = "kaplan-meier", conf.int = 0.95, conf.type = "log",
  ggtheme = theme_minimal(), titleSurv = "Survival curves",
  titleCuminc = "Cumulative incidence functions", xtitle = "Time",
  ytitleSurv = "Probability of survivng up to time t",
  ytitleCuminc = "Cumulative incidences", legendtitle = "Group",
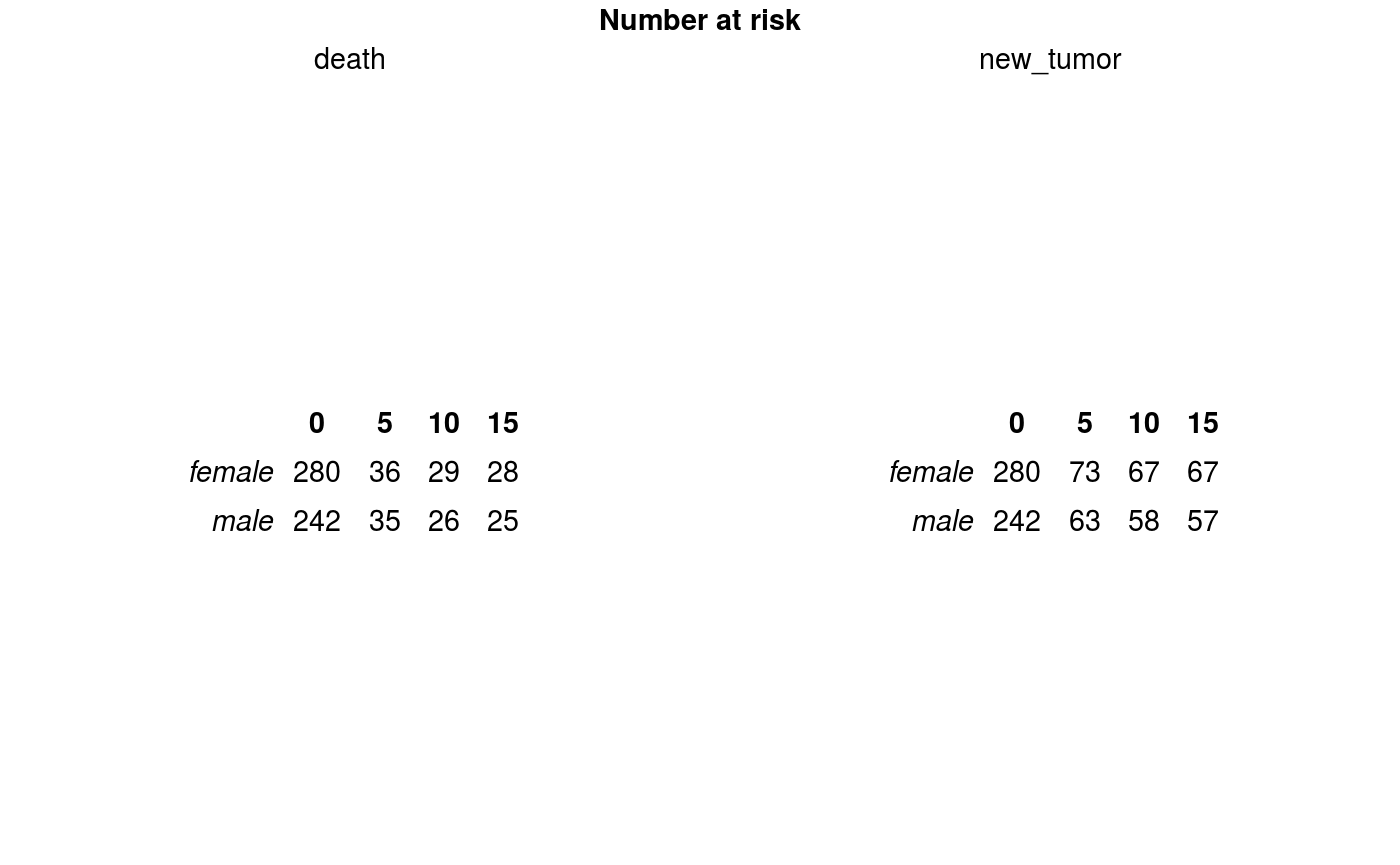
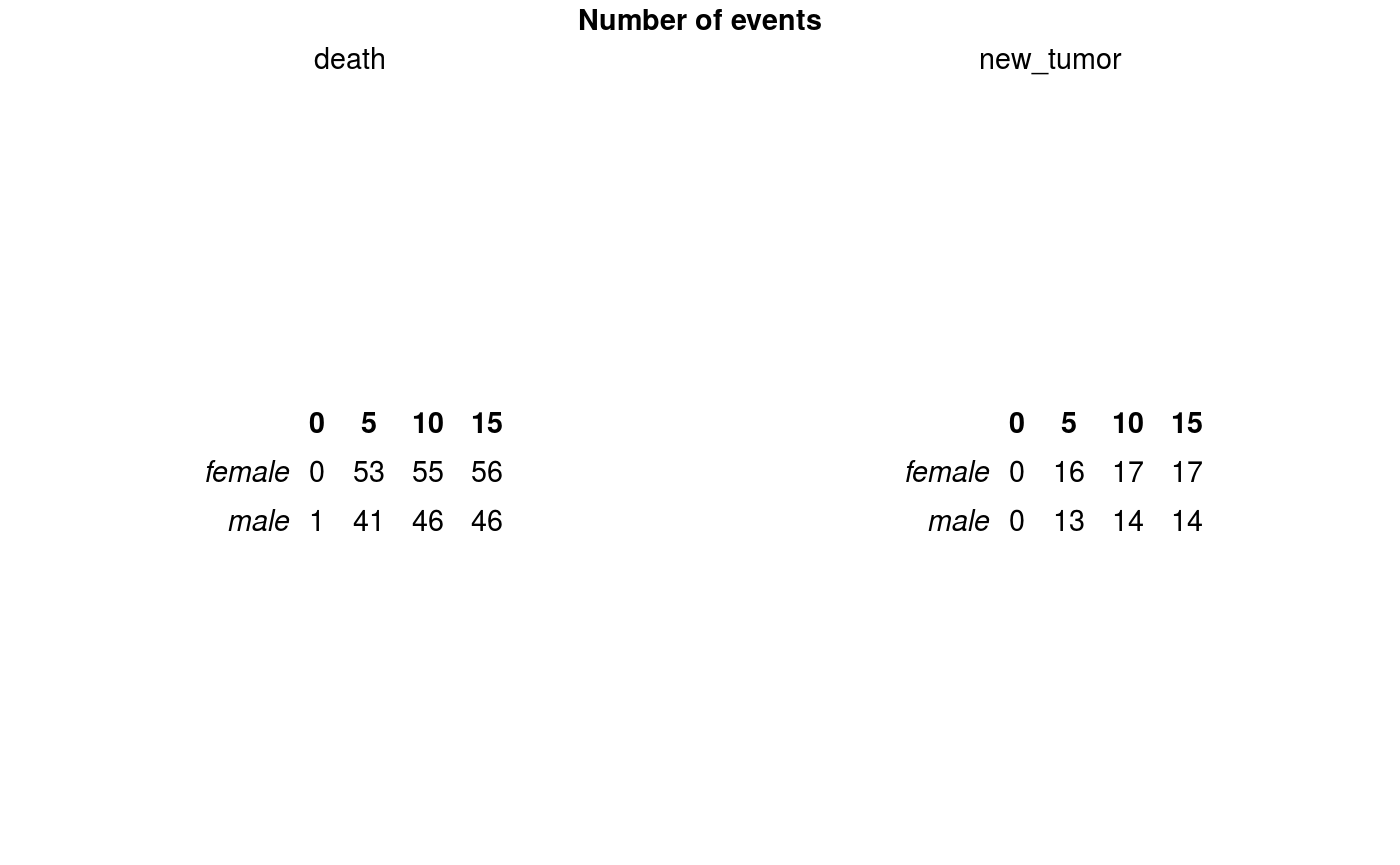
  riskTabTitle = "Number at risk", eventTabTitle = "Number of events")
Arguments
| time | vector with times of an event or follow-up, must be numeric. |
|---|---|
| risk | vector with type of event, can be numeric or factor/character. |
| group | vector with group variable, can be numeric or factor/character. |
| cens | value of 'risk' indicating censored observation (if NULL, the first value of 'risk' vector will be taken). |
| rho | rho parameter from Fleming-Harrington Test. |
| target | point in time, in which the confidence bounds should be plotted (default NULL, no confidence bounds plotted). |
| type | type of survival curve to be fitted. Possible values are "kaplan-meier" (default), "fleming-harrington" or "fh2". |
| conf.int | conf.int level of two-sided confidence interval (default = 0.95). |
| conf.type | type of confidence interval. Possilble values: "none", "plain", "log" (default), "log-log". |
| ggtheme | ggtheme to be used in plots (default: theme_minimal()). |
| titleSurv | a title of a survival curves plot (default: "Survival curves"). |
| titleCuminc | a title of a cumulative incidences plot (default: "Cumulative incidence functions"). |
| xtitle | a title of x axis of survival curves and cumulative incidences plots(default: "Time"). |
| ytitleSurv | a title of y axis of survial curves plot (default: "Probability of survivng up to time t"). |
| ytitleCuminc | a title of y axis (default: "Cumulative incidences"). |
| legendtitle | a title of a legend (default: "Group"). |
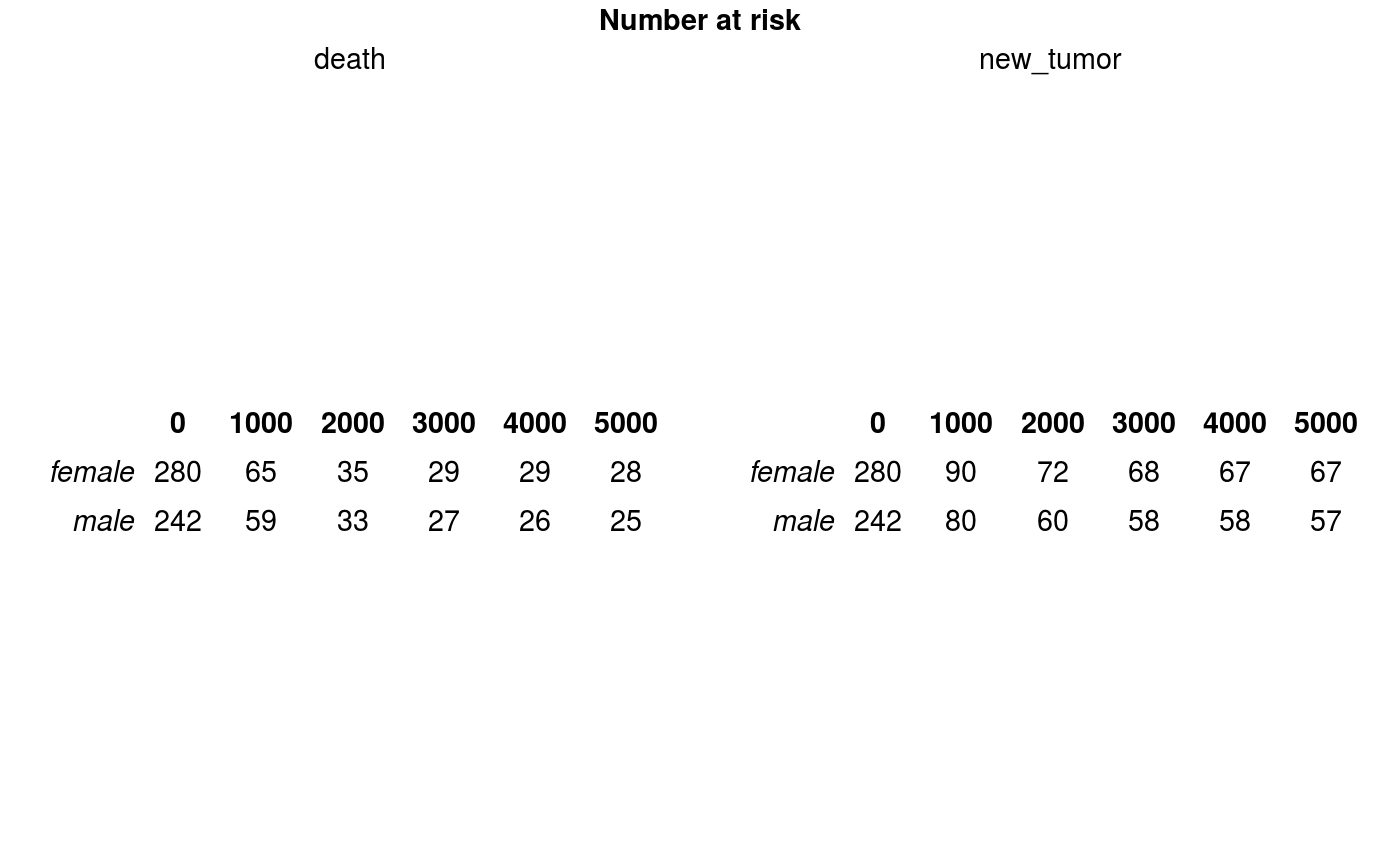
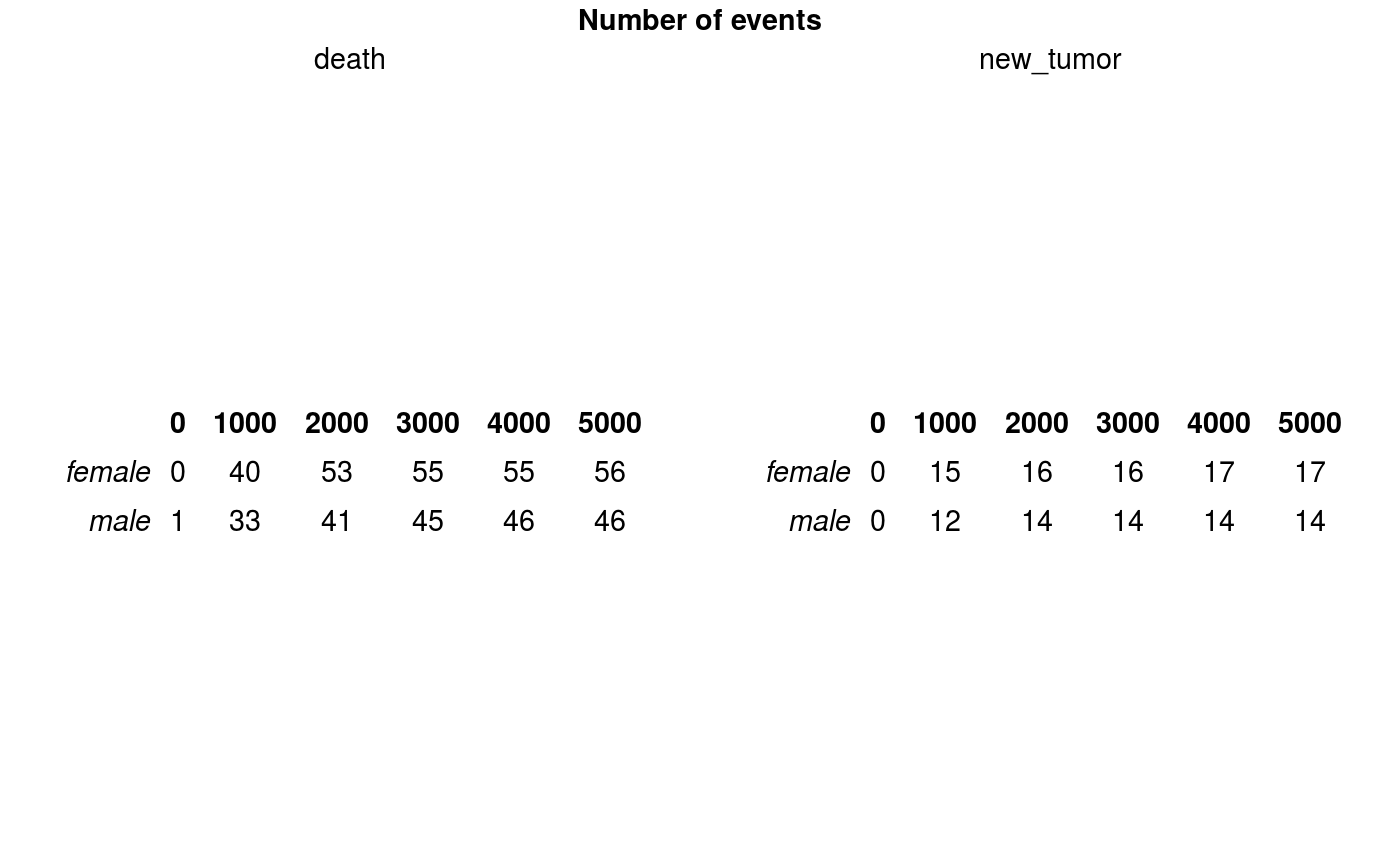
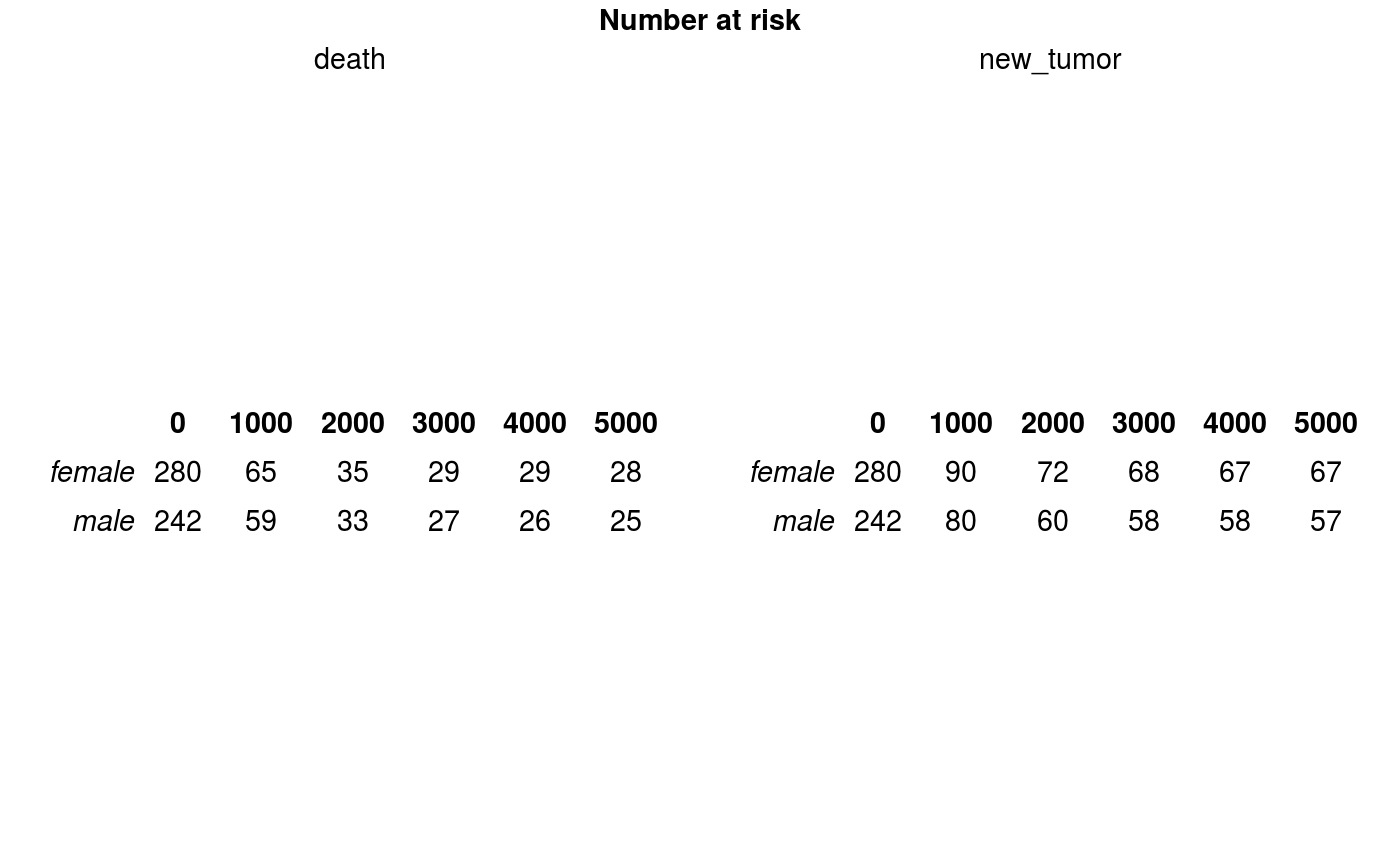
| riskTabTitle | a title of table with number at risk. |
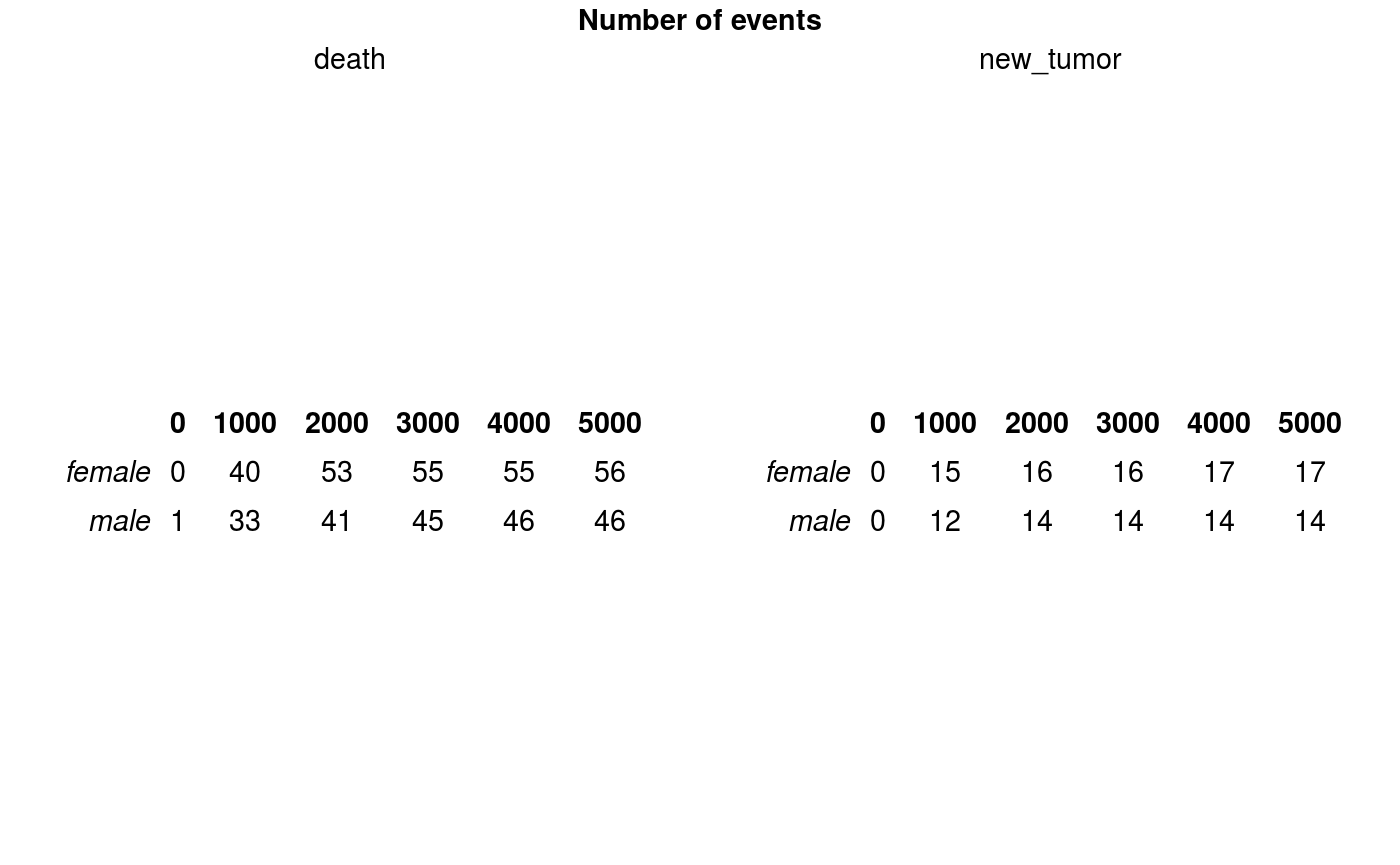
| eventTabTitle | a title of table with number of events. |
Value
Results of all functions implemented in the package summarised in an one-page report.
Examples
summarizeCR(time = LUAD$time/365, risk = LUAD$event, group = LUAD$gender, cens = "alive")#> 19 cases omitted due to missing values #> 19 cases omitted due to missing values #> 19 cases omitted due to missing valuessummarizeCR(time = LUAD$time, risk = LUAD$event, group = LUAD$gender, cens = "alive", target = 1200, type = "fleming-harrington", conf.int = 0.99, conf.type = "log-log", ggtheme = theme_bw())#> 19 cases omitted due to missing values #> 19 cases omitted due to missing values #> 19 cases omitted due to missing valuessummarizeCR(time = LUAD$time, risk = LUAD$event, group = LUAD$gender, cens = "alive", rho = 1, target = 800, type = "kaplan-meier", ggtheme = theme_gray(), titleSurv = "Survival analysis", titleCuminc = "Competing risks models", xtitle = "Days", ytitleSurv = "Survival curves", ytitleCuminc = "Cumulative incidence functions", legendtitle = "Gender")#> 19 cases omitted due to missing values #> 19 cases omitted due to missing values #> 19 cases omitted due to missing values
