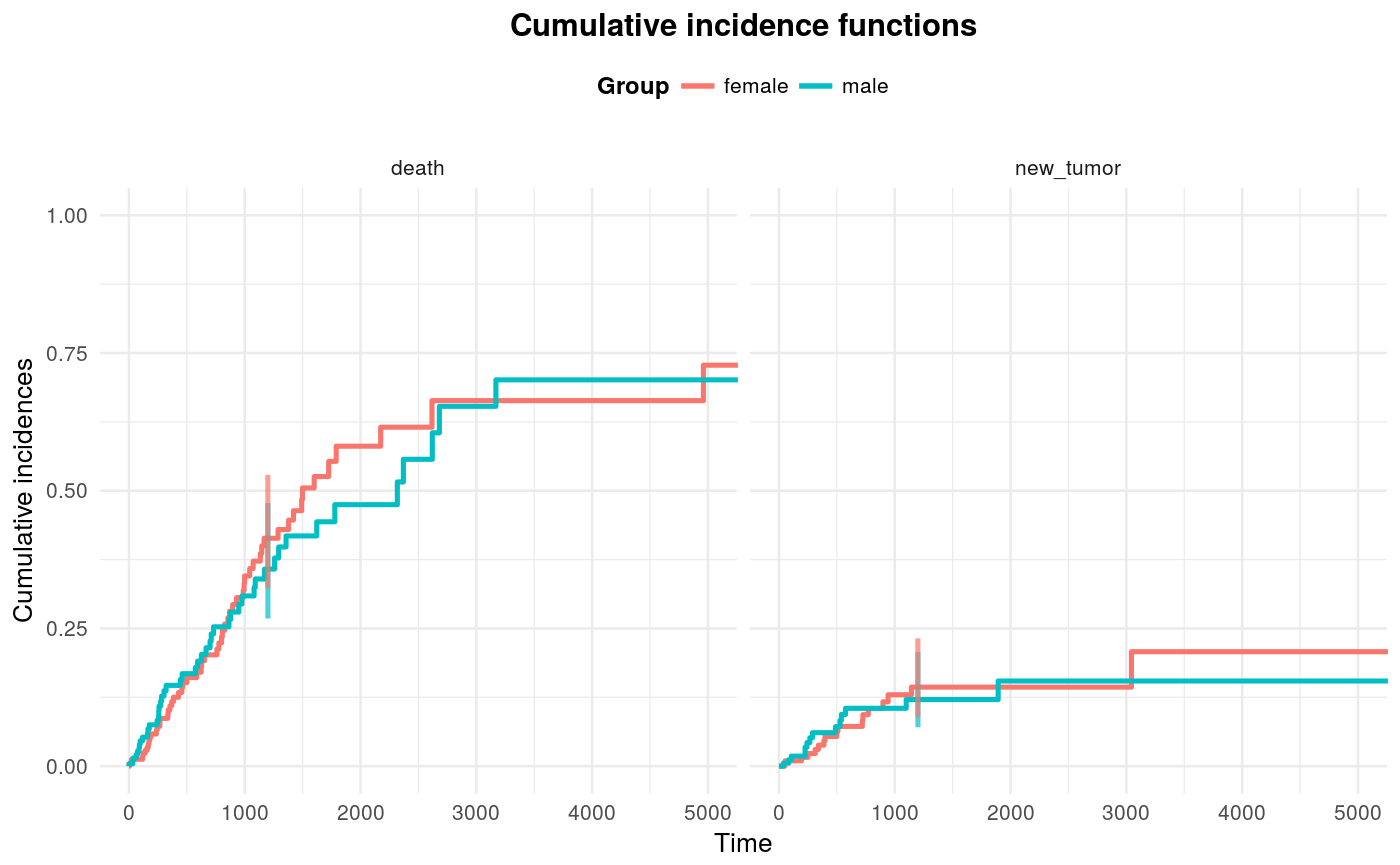
Cumulative incidences curves
Plots cumulative incidences curves for each risk and group.
plotCuminc(ci, cens = NULL, target = NULL, ggtheme = theme_minimal(),
  titleCuminc = "Cumulative incidence functions", xtitle = "Time",
  ytitleCuminc = "Cumulative incidences", legendtitle = "Group")
Arguments
| ci | a result of function fitCuminc. |
|---|---|
| cens | value of 'risk' indicating censored observation (default 0). |
| target | point in time, in which the confidence bounds should be plotted (default NULL, no confidence bounds plotted). |
| ggtheme | ggtheme to be used (default: theme_minimal()). |
| titleCuminc | a title of a plot (default: "Cumulative incidence functions"). |
| xtitle | a title of x axis (default: "Time"). |
| ytitleCuminc | a title of y axis (default: "Cumulative incidences") |
| legendtitle | a title of a legend (default: "Group"). |
Value
a ggplot containing n graphs, where n is number of risks. Each graph represents cumulative incidence curves for given risk. One curve corresponds to one group.
See also
ggplot ggtheme
Examples
#> 19 cases omitted due to missing valuesplotCuminc(ci = fitC, cens = "alive", target = 1200)