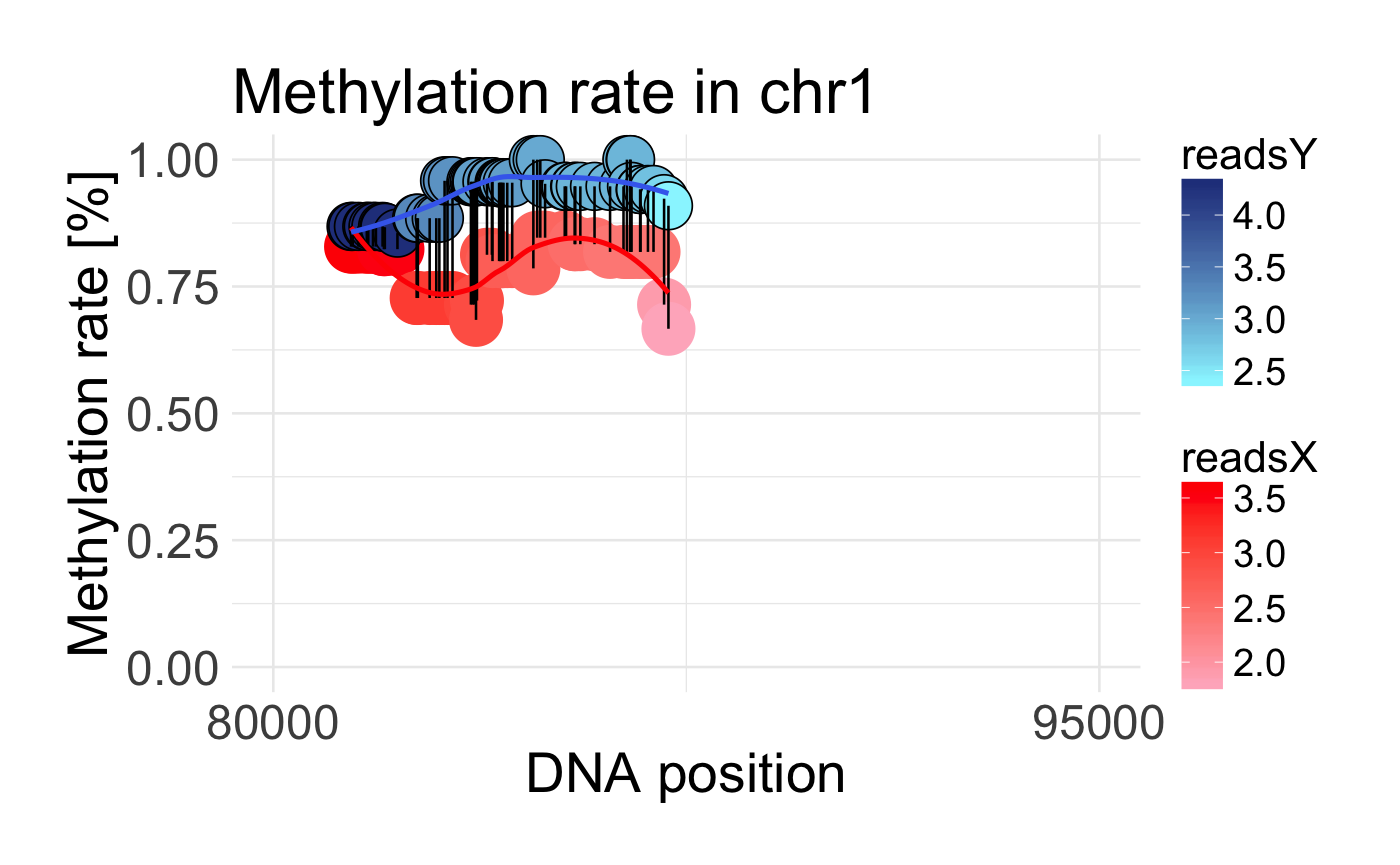
Plot DMR region
Visualizing DMR region by plotting methylation rate within two probes
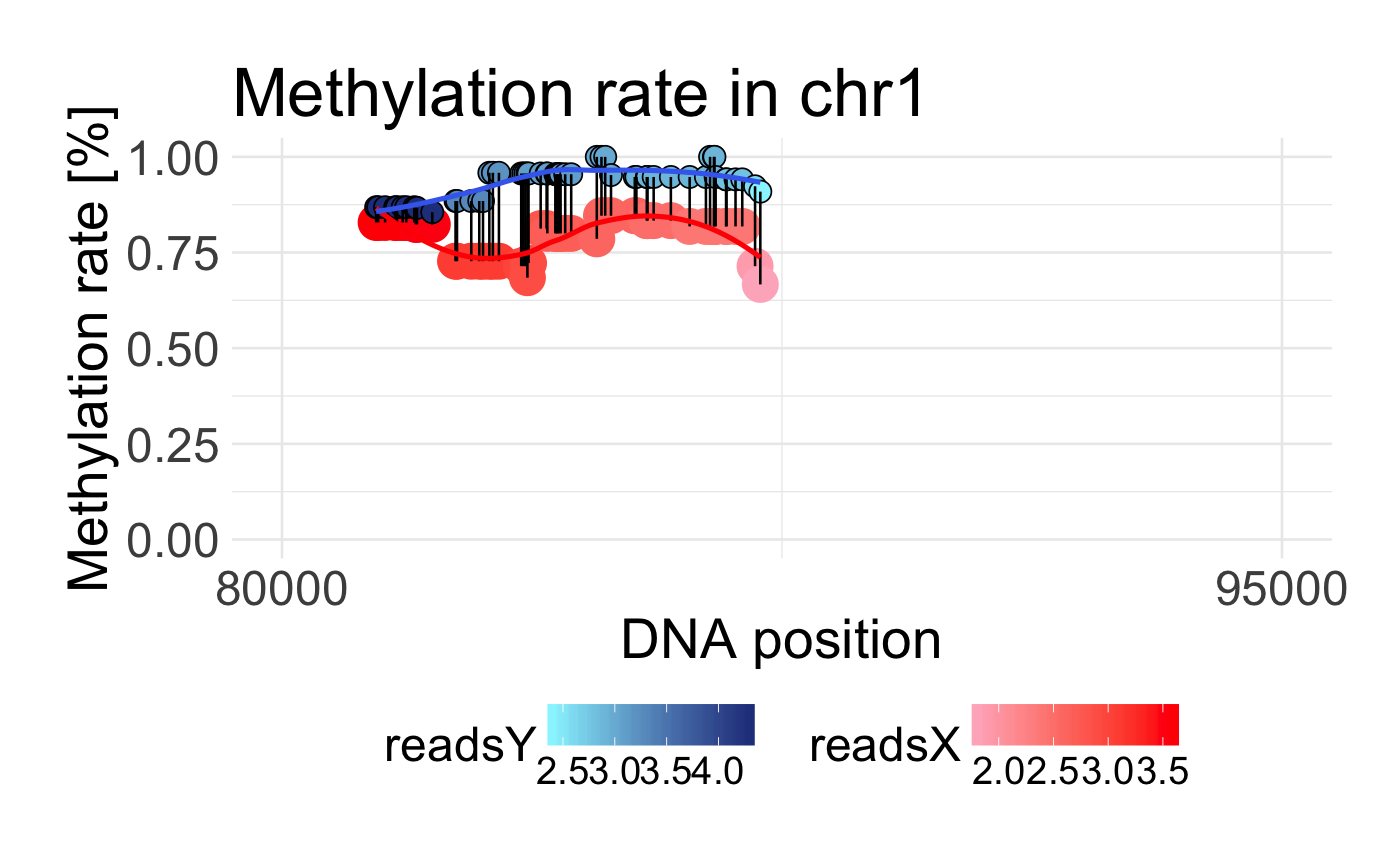
draw_methylation(data, chromosom, start, end, bind.probes = T,
  smooth.methylation = T, size.x.dot = 15, size.y.dot = 9,
  plot.title = 26, axis.title.x = 23, axis.title.y = 23,
  legend.position = "right", axis.text.x = 20, axis.text.y = 20,
  legend.text = 16, legend.title = 18)
Arguments
| data | There are two options: 1. dataframe with specific columns: chr, poz, prob, no, meth, unmeth, meth.rate. This dataframe is result of function preprocessing. 2. dataframe with specific columns: chr, poz, prob, no, meth, unmeth, meth.rate, tiles and possible tiles.common columns. This dataframe is result of function create.tiles.min.gap or create.tiles.fixed.length. |
|---|---|
| start | minimum position of region that are being plotted |
| end | maximum position of region that are being plotted |
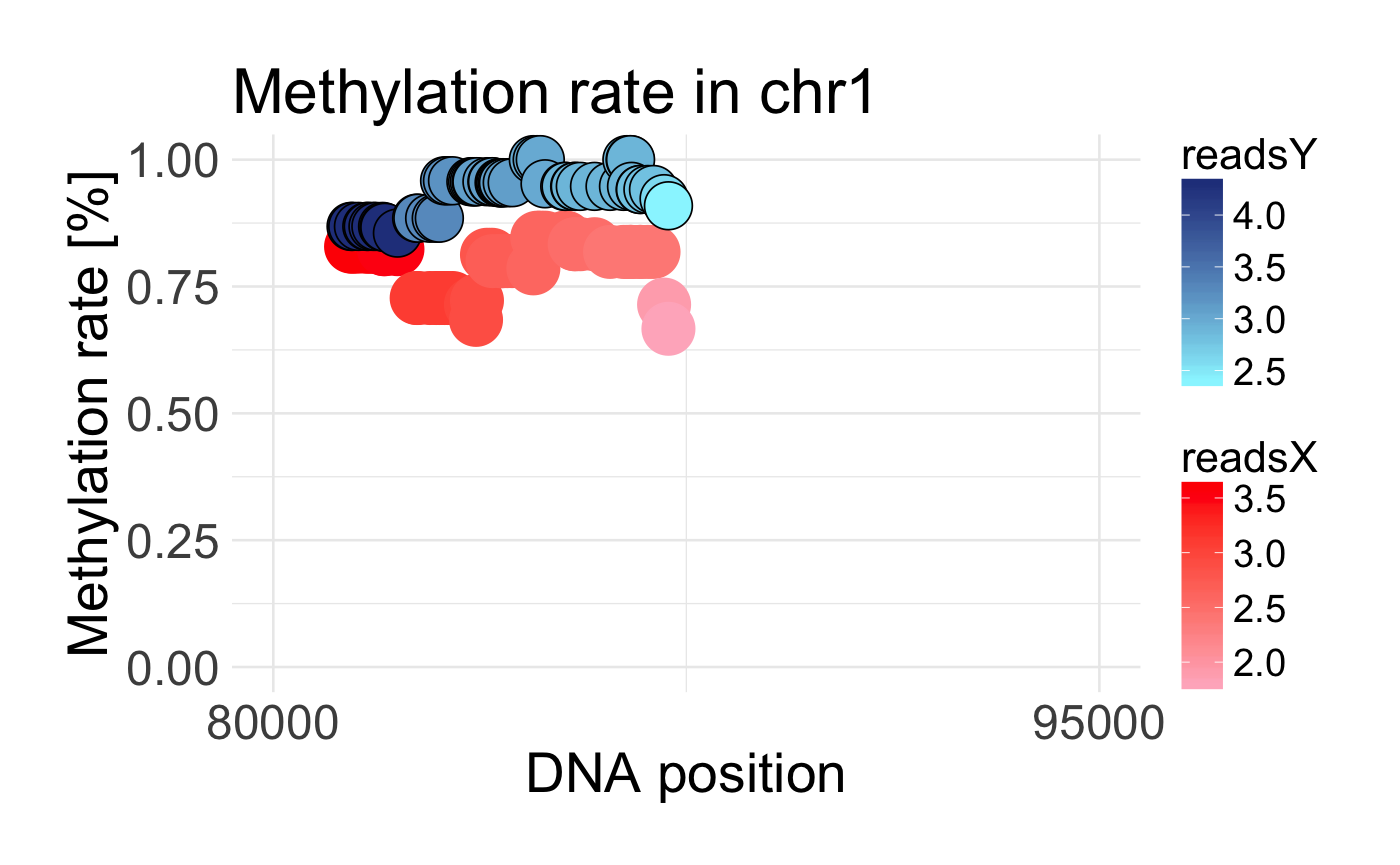
| bind.probes | if TRUE methylation rates on the same position will be binded by vertical lines |
| smooth.methylation | if TRUE methylation rates in two probes will be smoothed |
| chr | chromosome name of region that are being plotted |
Value
ggplot object with visualization of regions
Examples
data('schizophrenia') control <- schizophrenia %>% filter(category == 'control') %>% dplyr::select(-category) disease <- schizophrenia %>% filter(category == 'disease') %>% dplyr::select(-category) data <- preprocessing(control, disease) draw_methylation(data, chr = 'chr1', start = 80000, end = 95000)#without binding lines and smoothing draw_methylation(data, chr = 'chr1', start = 80000, end = 95000, bind.probes = F, smooth.methylation = F)# with changing some ggplot2 arguments: draw_methylation(data, chr = 'chr1', start = 80000, end = 95000, legend.title = 20, legend.position = 'bottom', plot.title = 28, size.x.dot = 10, size.y.dot = 4)